
18 Offers, One Home.
What March's Bidding Wars Reveal About Spring


A four-bedroom home on Oak Avenue in the Manhattan Beach Tree Section listed at $2.199 million on a Tuesday. By Thursday, the listing agent had stopped taking showings. By the following week, the seller was sorting through 18 offers. The home closed at $2.525 million — $326,000 over asking, a 15% premium — in four days on market.
This was not a Strand-front estate with panoramic ocean views. It was not a brand-new construction with a rooftop deck and a four-car garage. It was a 1,996-square-foot home on a standard lot in a desirable neighborhood, priced honestly. And 18 buyers wanted it badly enough to compete for it.
That sale, reported by MB Confidential on March 2, tells you more about the spring market in Manhattan Beach than any national headline you’ll read this week. Because while the rest of the country is talking about rising inventory, softening prices, and a shift toward buyers, the South Bay is doing something different entirely. It’s accelerating.
The Math That Matters: More Pendings Than Listings
The most important data point from the first half of March isn’t a sale price or a days-on-market figure. It’s a ratio.
Between March 1 and March 15, Manhattan Beach recorded 18 new listings and 20 new pending sales. [1] Read that again. More homes went under contract than came to market. The market absorbed inventory faster than sellers could replenish it.
Total active inventory held flat at 55 properties — 40 single-family homes and 15 townhomes — identical to the count at the end of February. [1] But that flat number masks a more revealing shift underneath. The Sand Section, Manhattan Beach’s most coveted residential enclave between Highland Avenue and the ocean, lost two active listings, dropping to 21. The Tree Section lost one, falling to nine. Meanwhile, East Manhattan Beach gained three, climbing to 22. [1]
The inventory isn’t just flat. It’s migrating. The most desirable locations are getting tighter while the more affordable eastern neighborhoods are seeing modest supply growth. This is the two-speed dynamic I described in my first Substack article playing out in real time — and the gap is widening, not narrowing.
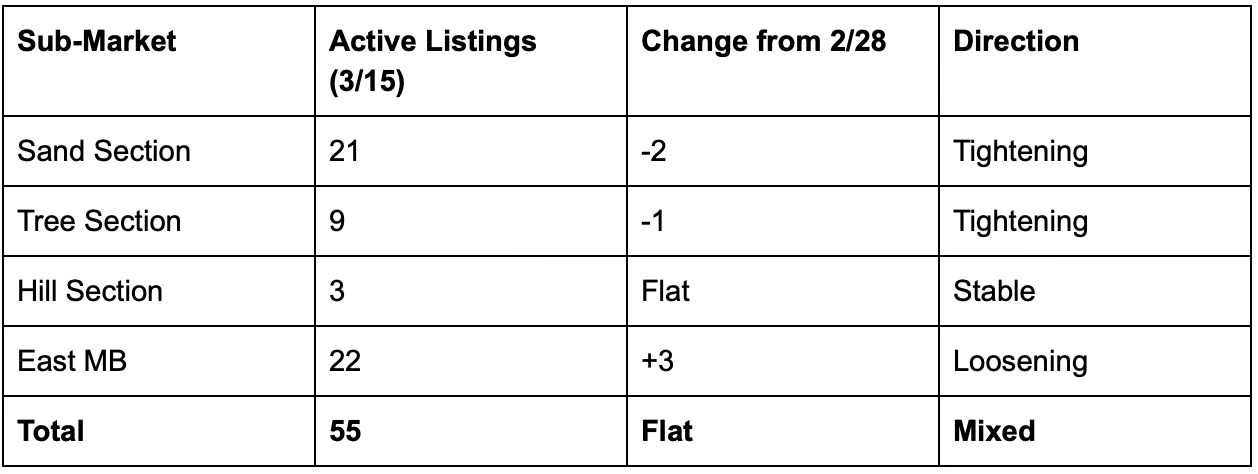
Source: MB Confidential, Manhattan Beach Real Estate Inventory as of 3/15/26 [1]
For context, nationally, active housing inventory rose 5.6% year over year in the week ending March 14, according to Realtor.com data reported by CNBC. [2] The RE/MAX National Housing Report showed months’ supply at 2.9 nationally in February, up from 2.7 a year earlier. [3] Sixty-six of the nation’s 200 largest housing markets now have inventory above pre-pandemic 2019 levels, according to ResiClub’s analysis of Realtor.com data — concentrated in the Sun Belt and Mountain West, where pandemic boomtown dynamics have reversed. [4]
Manhattan Beach is not one of those 66 markets. It is not even close. With 55 active listings serving a city of 35,000 people where the median home price exceeds $3 million, this remains one of the most supply-constrained residential markets in the country.
The Bidding Wars: Not Just Oak Avenue
The 1728 Oak story is dramatic, but it wasn’t an isolated event. The first half of March produced a pattern of competitive sales across Manhattan Beach that suggests the buyer pool is deeper and more aggressive than many sellers realize.
Consider the evidence. At 2921 Poinsettia in the Tree Section, a three-bedroom home listed at $2.8 million drew multiple offers and closed at $3 million — $200,000 over asking. MB Confidential’s Dave Fratello described it as the listing that “revealed that there is a pool of buyers ready to go. And we saw them all again later.” [1] That last sentence is the key. The same buyers who lost on Poinsettia showed up again on Oak, and on Alma, and on Magnolia. They are not casual shoppers. They are motivated, pre-approved, and ready to move.
At 2215 Alma, a custom remodel with ocean views listed at $4.2 million on a Friday. It went under contract the following Monday. It closed 11 days later at full asking price. [1] At 1612 Magnolia, new construction closed at $4.1 million — 5% above the $3.999 million asking price, with five competing offers. [1] At 449 South Prospect, a single-level mid-century home on a cul-de-sac closed at $2.75 million, $150,000 over asking, after just four days on market. [1]
Even at the top of the market, capital moved decisively. A newer three-story home near downtown at 620 12th Street closed at $9 million — $500,000 over the $8.5 million list price — in what appeared to be an off-market transaction. [1]
The only notable exception was 4016 The Strand, which closed at $7.95 million, slightly below its $8.199 million asking price. [1] At the ultra-luxury tier, buyers remain strategic. But the broader pattern is unmistakable: well-priced homes in desirable locations are not just selling. They are selling over asking, in days, with multiple offers.
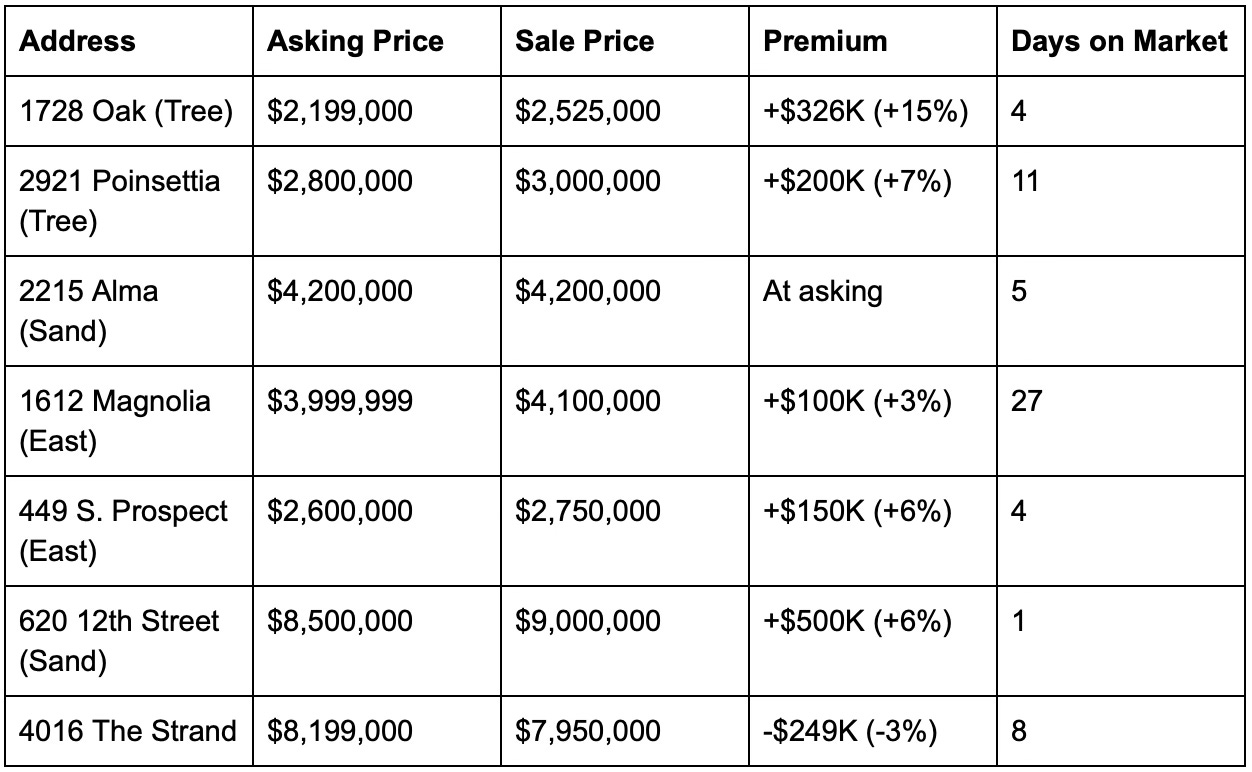
Source: MB Confidential, Manhattan Beach Market Update for 3/15/26 [1]
The $2M–$4M Battleground
If you zoom out from individual transactions and look at where the competition is concentrated, a clear pattern emerges. The fiercest bidding wars are happening in the $2 million to $4 million range.
This is not a coincidence. The $2M–$4M band is where three distinct buyer pools converge. Move-up buyers from Redondo Beach and other South Bay cities, looking to upgrade into Manhattan Beach for the schools and the lifestyle. Downsizers from larger Sand Section or Hill Section homes, looking to right-size without leaving the community. And first-time Manhattan Beach buyers — often dual-income professionals in their late 30s and 40s — making their initial entry into the market.
All three groups are competing for the same limited pool of homes. A renovated three-bedroom in the Tree Section. A townhome near downtown. A smaller home in the Sand Section with renovation potential. These are the properties that drew 18 offers. These are the properties where the premium over asking is measured in hundreds of thousands of dollars.
Above $8 million, the market operates differently. Buyers at this level are fewer, more deliberate, and less likely to engage in bidding wars. The 4016 Strand sale — closing below asking — reflects a luxury market where negotiation, not competition, is the norm. Below $2 million, there is almost nothing to buy in Manhattan Beach. The entry-level market has effectively ceased to exist as a meaningful category.
The $2M–$4M range is the pressure point. And based on the first half of March, that pressure is intensifying, not easing.
The National Divergence
It is worth pausing to acknowledge how unusual Manhattan Beach’s spring market is in the context of what’s happening nationally.
Home sales across California hit their lowest level in 23 months in January 2026, according to the California Association of Realtors. [5] Nationally, the housing market is broadly described as shifting toward balance. Realtor.com forecasts a 2.2% increase in the median price of existing homes for 2026 — modest growth, not the double-digit appreciation of the pandemic era. [6] The National Association of Realtors notes that while inventories have improved, the number of for-sale signs remains approximately 17% below pre-pandemic norms. [7] Ameriprise’s 2026 outlook projects the housing market to grow about 5% overall, with “slightly better conditions than 2025.” [8]
The language is measured. Balanced. Cautiously optimistic. None of it describes what is happening in Manhattan Beach, where homes are drawing 18 offers and closing 15% over asking in four days.
The divergence has a structural explanation. As I detailed in my previous article on the Spring Inventory Paradox, the national inventory recovery has been concentrated at price points below $500,000 and in regions — the Sun Belt, Mountain West — where pandemic-era overbuilding created a supply glut. [9] At the $1 million-plus tier where Manhattan Beach operates, inventory growth has been the weakest of any price bracket nationally. The lock-in effect, which keeps homeowners with sub-3% mortgages from selling, is most acute in high-cost coastal markets where the dollar value of the rate differential is enormous.
The result is a market that is structurally disconnected from the national narrative. When you read headlines about “a more balanced housing market emerging” or “fewer extreme bidding wars,” understand that those descriptions apply to Austin, Tampa, and Phoenix. They do not apply to the Sand Section.
The Olympic Factor: A New Variable
One development worth noting, even if its full impact remains uncertain, is the growing connection between the 2028 Los Angeles Olympics and Manhattan Beach real estate.
On March 13, a property at 1000 The Strand listed at $25 million — a 10-bedroom, 9-bathroom, 5,967-square-foot oceanfront estate positioned, in the words of the New York Post, as “a front-row seat to the 2028 Olympics.” [10] Beach volleyball, one of the Games’ most-watched events, will be held at a temporary venue on the beach in neighboring Long Beach, with Manhattan Beach’s coastline not too far away.
The listing is a trophy property, and its price reflects that. At $4,190 per square foot, it is not a data point that tells us much about the broader market. But the narrative around it — the idea that Manhattan Beach is an Olympic-adjacent community, that global visibility is coming, that infrastructure spending and tourism will follow — is beginning to filter into market psychology.
Historically, the “host city effect” on real estate is real but nuanced. Research on prior Olympic host cities shows measurable increases in property values in neighborhoods adjacent to venues, driven by infrastructure improvements, increased global awareness, and a surge in short-term rental demand during the Games themselves. [11] The effect is strongest in the two years leading up to the event — which is exactly where we are now.
It would be premature to attribute any of the current bidding activity to Olympic anticipation. The fundamentals — constrained supply, deep buyer demand, the lock-in effect — are more than sufficient to explain what’s happening. But the Olympics add a tailwind that didn’t exist a year ago, and it’s worth watching as we move through 2026 and into 2027.
Why This Isn’t 2021
The obvious comparison — and the one I hear most often from clients — is to the pandemic-era frenzy of 2021, when bidding wars were the norm, homes sold sight-unseen, and buyers waived every contingency to win.
The comparison is understandable but misleading. The current market shares one characteristic with 2021 — intense competition for limited inventory — but the underlying dynamics are fundamentally different.
In 2021, mortgage rates were between 2.75% and 3%. Today, they are in the 6.5% to 7% range. [2] That difference alone changes the character of the buyer pool. The buyers competing for 1728 Oak are not panic-buying. They are not waiving inspections to win a bidding war fueled by cheap money and fear of missing out. They are well-capitalized, often making substantial down payments, and they are competing because the home was genuinely well-priced in a market with genuine scarcity.
The 15% premium on Oak Avenue is not a sign of irrational exuberance. It is a sign that the listing agent priced conservatively — perhaps intentionally — and the market corrected to fair value through competition. Dave Fratello’s assessment in MB Confidential was characteristically measured: “We’re going to say the listing looked maybe a little cautious out of the blocks, but not 15% underpriced.” [1]
That distinction matters. The 2021 market was driven by FOMO and historically cheap debt. The 2026 market is driven by structural scarcity and genuine demand. One was a sugar high. The other is a reflection of fundamentals. The outcomes may look similar — multiple offers, over-asking closings — but the foundation is healthier, and the risk of a sharp correction is correspondingly lower.
What This Means for You
If you’re a seller: The first half of March confirms that spring timing is working. But the homes that generated the most competition — Oak, Poinsettia, Alma, Prospect — share a common trait: they were priced with precision, not aspiration. The sellers who started at market value or slightly below it created the conditions for competitive bidding. The sellers who started high — and there are always a few — are still sitting. Pricing strategy is not a concession. It is a weapon.
The data also suggests that the week of April 12-18 may be the optimal listing window nationally, according to Realtor.com’s analysis. [6] In Manhattan Beach, where the market runs ahead of national seasonality, the window is arguably already open. If you’re planning to list this spring, the buyers are here. They showed up 18 at a time on Oak Avenue.
If you’re a buyer: The $2M–$4M range is going to remain competitive through spring. If you’re targeting the Tree Section or Sand Section in that price band, prepare for multiple-offer situations on well-priced homes. That means having your financing locked, your offer terms clean, and your decision-making fast. The homes that drew the biggest premiums in March were the ones that moved in days, not weeks.
Above $4 million, you have more room to negotiate. The 4016 Strand closing below asking shows that even in a strong market, the ultra-luxury tier operates on different rules. Patience and precision matter more than speed at the top.
If the Sand Section feels out of reach, pay attention to East Manhattan Beach, where inventory is growing (+3 actives in the first half of March) and the competition, while still present, is less intense. The value proposition east of Sepulveda is real, and the schools are the same.
If you’re watching: The spring market is confirming the thesis from my first two articles. The South Bay is structurally disconnected from the national inventory recovery. The lock-in effect is keeping supply constrained. And within Manhattan Beach, the market is not monolithic — it’s a collection of micro-markets, each with its own supply-demand dynamics, moving at different speeds.
The March data doesn’t change the story. It sharpens it.
Gary Senser is a residential real estate strategist with Botello & Senser at ESTATE PROPERTIES, specializing in Manhattan Beach, Hermosa Beach, and Redondo Beach. For questions or a confidential market consultation, reach him at 310-383-2779.
DRE #01903493
Sources
[1]: MB Confidential. “Winter Sales Piling Up — Manhattan Beach Market Update for 3/15/26.” March 17, 2026. https://www.mbconfidential.com/blog/manhattan-beach-market-update-for-31526.html
[2]: CNBC. “The spring housing market is on, but mortgage rates just climbed.” March 20, 2026. https://www.cnbc.com/2026/03/20/spring-housing-market-mortgage-rates.html
[3]: RE/MAX. “National Housing Report for February 2026.” March 17, 2026. https://www.prnewswire.com/news-releases/remax-national-housing-report-for-february-2026-302714996.html
[4]: ResiClub. “66 housing markets enter spring 2026 above a key inventory threshold that benefits homebuyers.” March 17, 2026.
https://www.resiclubanalytics.com/p/66-housing-markets-above-key-inventory-threshold-giving-homebuyers-some-power
[5]: BayLegal. “War And Gas Prices: Why California’s Spring Home Sales Are Suddenly At Risk.” March 17, 2026. https://baylegal.com/war-and-gas-prices-why-californias-spring-home-sales-are-suddenly-at-risk/
[6]: Realtor.com. “The Best Time To Sell: The Week of April 12-18.” March 17, 2026. https://www.realtor.com/research/best-time-to-sell-2026/
[7]: National Association of Realtors. “How Agents Can Help Pinpoint the ‘Best Time to Sell’ in 2026.” March 18, 2026. https://www.nar.realtor/magazine/real-estate-news/how-agents-can-help-pinpoint-the-best-time-to-sell-in-2026
[8]: Ameriprise. “Is the housing market poised for a comeback in 2026?” March 15, 2026. https://www.ameriprise.com/financial-news-research/insights/housing-market-outlook-2026
[9]: Senser, Gary. “The Spring Inventory Paradox: Why the South Bay Is Tightening While the Rest of the Country Loosens.” Your Real Estate Insider (Substack). March 10, 2026.
[10]: New York Post. “Exclusive | Manhattan Beach home has views of Olympic beach volleyball.” March 17, 2026. https://nypost.com/2026/03/17/real-estate/manhattan-beach-home-has-views-of-olympic-beach-volleyball/
[11]: General research on Olympic host city real estate effects. Historical data from London 2012, Rio 2016, and Tokyo 2020 host city property markets.